

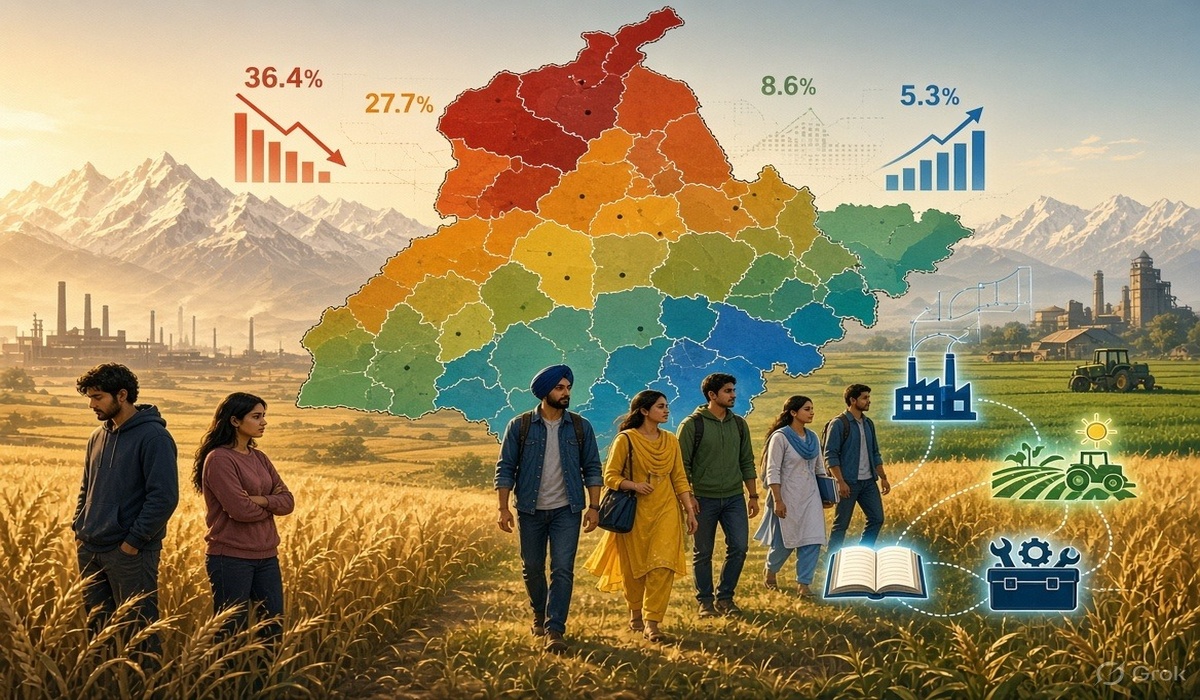

The picture of employment in Punjab is not the same in every district. Instead of viewing the state’s unemployment rate merely as a single figure, when the picture is seen at the district level, many major differences come to light.
The first district-level labor market estimates released by the National Statistical Office (NSO) under the Ministry of Statistics and Programme Implementation (MoSPI) show a significant difference in employment, unemployment, and the condition of youth aged 15 to 29 in Punjab who are neither employed, nor studying, nor engaged in any training.
These figures also provide an opportunity to compare Punjab with the picture of neighboring states Haryana and Himachal Pradesh, as well as other parts of the country.
Released on September 18, the “Labour Market Snapshot of Selected Districts (PLFS 2025)” is the first report of its kind under the revised Periodic Labour Force Survey (PLFS). From January 2025, districts were made the primary sampling unit for most parts of the country, making it possible to generate data at the district level for the first time.
The government has also clarified that these estimates have a probability of sampling error and they should not be directly compared with older PLFS data, as previously the data were prepared on the basis of NSS regions.
What does the overall picture of Punjab say?
- The Labour Force Participation Rate (LFPR) for the population aged 15 years and above in Punjab stood at 55.2 percent. This means that 55.2 percent of the population in this age group were connected to the job market — either working or seeking/available for work.
- Punjab’s Worker Population Ratio (WPR) stood at 52.3 percent and the unemployment rate was 5.3 percent.
- Along with this, 27.7 percent of youth aged 15 to 29 were neither in employment, nor in education, nor in any training. This is called the NEET rate.
- In Haryana, the LFPR was 50.4 percent, WPR 48.1 percent, unemployment rate 4.5 percent, and NEET rate 27.2 percent.
- The picture in Himachal Pradesh was different from this. There, the LFPR was 73.2 percent and WPR was 69.9 percent, which is significantly higher than both Punjab and Haryana. Himachal’s unemployment rate was 4.5 percent, while the NEET rate for youth stood at 20.5 percent.
Punjab’s 5.3 percent unemployment rate does not tell the full picture
Punjab’s overall unemployment rate is 5.3 percent, but district-level figures show that conditions are not the same in every part of the state.
Among the selected Punjabi districts, Gurdaspur had the highest unemployment rate at 8.6 percent. This was followed by Amritsar at 8.3 percent. In Hoshiarpur, this rate was 7.3 percent and in Jalandhar 6.0 percent. On the other hand, the unemployment rate in Sangrur was 3.0 percent. In Bathinda, it was 3.2 percent and in Mohali 3.6 percent.
Looking at people’s participation in the labor market, the difference becomes even clearer. Among the selected Punjabi districts, Patiala’s LFPR was the highest at 61.2 percent. This was followed by Ludhiana at 58.8 percent and Bathinda at 58.1 percent. Conversely, Jalandhar’s LFPR was 48.0 percent and Gurdaspur’s was 48.1 percent. One thing needs to be understood here. The unemployment rate and LFPR do not measure the same thing.
The unemployment rate looks at those people who are part of the labor force but do not have work. LFPR tells how many people out of the total population are participating in the labor market — that is, working or seeking/available for work. Therefore, a lower unemployment rate does not automatically mean that more people have jobs.
The picture of Punjab’s youth raises more questions
One of the most striking statistics for Punjab is the 27.7 percent NEET rate for youth aged 15 to 29. In simple words, more than one in every four youths in this age group were neither working, nor studying, nor engaged in any training. But the state’s average figure also does not tell the whole picture.
In Gurdaspur, the NEET rate stood at 36.4 percent. This means more than one in three youths in this age group were not connected with employment, education, or training. In Amritsar, this rate was 33.9 percent and in Hoshiarpur 29.9 percent. On the other hand, the NEET rate in Bathinda was 20.7 percent, in Sangrur 21.9 percent, and in Fazilka 22.3 percent.
It is also necessary to understand the difference between NEET and unemployment here. To come under the NEET category, it is not necessary for a youth to be actively looking for a job. If a youth is neither employed, nor in education, nor in any training, they can fall into the NEET category. Therefore, the NEET rate cannot be considered directly as the unemployment rate.
This raises another big question — how many youths are there who are currently neither connected to employment nor to such education or training that could lead them to employment in the future?
The same challenge for youth in Haryana as well
Punjab is not alone. Haryana’s overall NEET rate was 27.2 percent, which is quite close to Punjab’s 27.7 percent rate. Big differences are also seen among Haryana’s districts.
In Sirsa, the NEET rate was 36.3 percent, which is almost equal to Gurdaspur’s 36.4 percent rate. In Palwal, this rate was 35.0 percent and in Panipat 29.6 percent. On the other hand, the NEET rate in Karnal was 20.4 percent and in Gurugram 21.8 percent.
Haryana’s overall unemployment rate was lower than Punjab’s at 4.5 percent, but the difference among districts was significant here too.
In Yamunanagar, the unemployment rate was 7.4 percent, whereas in Sirsa it was only 1.8 percent. These figures show that the state’s average figure can sometimes obscure the actual condition of people living in a particular district.
Why is Himachal Pradesh’s picture different?
Comparing Punjab with Himachal Pradesh is also quite interesting. The hilly state’s LFPR stood at 73.2 percent, whereas in Punjab it was 55.2 percent and in Haryana 50.4 percent. Himachal’s WPR also stood at 69.9 percent.
The state’s overall NEET rate was 20.5 percent, which is lower than both Punjab and Haryana. But even in Himachal, the picture in every district is not the same. In Solan, the NEET rate was 39 percent, while in Chamba it was 7.7 percent. In a combined stratum made up of Lahaul and Spiti, Bilaspur, and Kinnaur, this rate was only 4.8 percent.
There was also a massive difference in unemployment. In Sirmaur it was 9.2 percent, in Solan 9.0 percent, whereas in Mandi it was only 0.8 percent. Therefore, Himachal’s high LFPR does not automatically indicate that the employment situation is the same in every district.
Punjab’s story is part of the country’s larger picture
District-level PLFS data also show how much regional variation exists in India’s labor market. Among the country’s 100 most populous districts, Surat in Gujarat had an LFPR of 68.6 percent. This was followed by Araria in Bihar at 68.0 percent and Salem in Tamil Nadu at 67.8 percent. Surat’s WPR also stood at 67.8 percent. The difference in the NEET rate for youth appears even more stark.
In Ernakulam, Kerala, the NEET rate was 9.6 percent, which was the lowest rate among the 100 most populous districts. This was followed by Coimbatore in Tamil Nadu at 14.5 percent and Bengaluru Urban in Karnataka at 15.0 percent.
In some districts of Gujarat, the NEET rate also remained relatively low. In Surat it was 17.2 percent, in Vadodara 18.1 percent, and in Ahmedabad 18.9 percent. In Raigad, Maharashtra, it was 18.5 percent.
On the other hand, the NEET rate remained quite high in many parts of the country.
According to an analysis of the same data, the state-level NEET rate in Bihar was 32.1 percent. In Telangana, it was 26.2 percent, in Maharashtra 21.9 percent, in Karnataka 20.8 percent, and in Gujarat 19.7 percent.
Thus, Punjab’s 27.7 percent NEET rate is not an isolated or unusual picture in the country. However, its higher prevalence in districts like Gurdaspur and Amritsar is a matter that separately warrants attention for Punjab.
What do the figures tell and what do they not?
These PLFS figures reveal a lot, but they do not automatically explain why these differences exist between districts.
For example, it cannot be determined from the data whether a youth is out of a job because there are no suitable jobs in their area, there is a mismatch between their skills and the requirements of available jobs, they are preparing for competitive exams, have migrated, educational opportunities are limited, or they are not working due to domestic responsibilities.
Investigating these causes would require separate research. But the figures certainly indicate that Punjab’s labor market cannot be understood solely by the 5.3 percent unemployment rate. For instance, if a person completely stops looking for a job, their situation is different from someone who is actively looking for one. Similarly, if a youth is studying, they do not fall into the NEET category, even if they do not have a job at that time.
Therefore, it is necessary to understand all four metrics together — LFPR, WPR, unemployment, and NEET.
Multiple pictures of employment in Punjab
Overall, the new data highlight stark differences in the employment situation within Punjab itself.
Punjab’s LFPR is 55.2 percent, which is higher than Haryana’s 50.4 percent but significantly lower than Himachal Pradesh’s 73.2 percent. Punjab’s unemployment rate is 5.3 percent, while in both Haryana and Himachal Pradesh it stood at 4.5 percent. The NEET rate for youth was 27.7 percent in Punjab, 27.2 percent in Haryana, and 20.5 percent in Himachal Pradesh. Even within Punjab, unemployment and NEET rates remained relatively high in Gurdaspur and Amritsar, while these figures were lower in Sangrur and Bathinda.
Perhaps the most important aspect of this entire picture is that the new district-level PLFS data no longer allow the discussion on Punjab’s employment to be limited to just a state average.
Now the questions are more specific:
Why is it difficult to connect youth with employment, education, or training in certain districts? Which are the most affected groups? Is the employment situation for young women different from that of young men? And for those who are finding work, what kinds of jobs are available? These PLFS figures do not answer all of these questions. But they certainly provide a new and crucial foundation for understanding Punjab’s labor market district-by-district.

Leave a Comment